Notes on T-tests
|
Practice Set
|
|

T-test -- Step 1
The Hypothesis: Reading ability as measured
by the ITBS will change for students who receive special tutoring in reading.
The Null Hypothesis: There will be no
change in reading ability as measured by the ITBS for students who receive
special tutoring in reading.
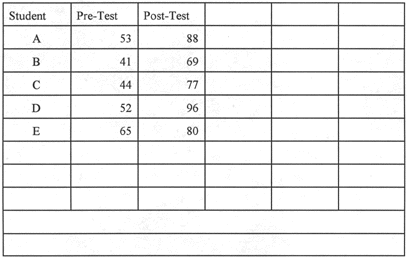
The first step is to enter the scores
on the pre-test for reading scores on the ITBS and the post-test scores
for reading on the ITBS.
Then look up in a Table of T values
to determine what value is the cutoff for rejecting the null hypothesis.
The degrees of freedom for one group is the sample size minus one. For
a sample size of 5, the degrees of freedom is 4. For an alpha of .05, degrees
of freedom of 4, and a two-tailed test, the t value will need to be greater
than 2.776.
|
Table 1
|
|

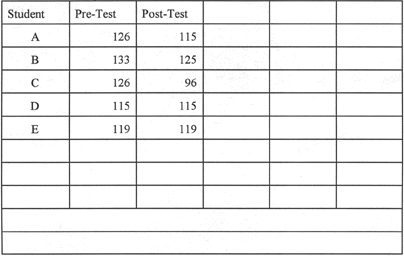
The second step is to calculate the
difference between each pre and post test scores.
|
Table 2
|

|

T-test -- Step 3
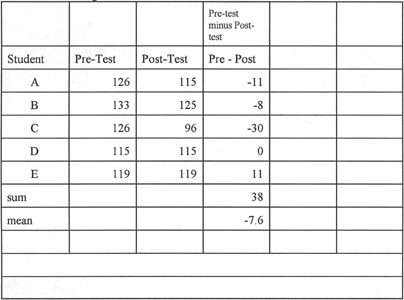
The third step is to sum the difference
scores and to calculate the mean of the difference scores. Remember, the
mean is calculated by dividing the sum by the number of students.
|
Table 3
|
|

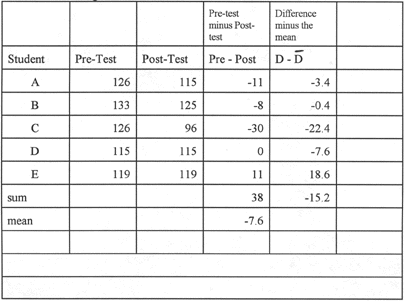
The fourth step is to subtract the
mean of the difference scores from each difference score. The results are
deviation scores.
Remember your signs. When you subtract
a negative number from any other number, the absolute value of the number
increases.
|
Table 4
|
|

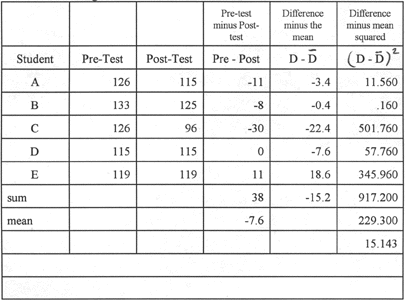
The fifth step is to square each of
the deviation scores.
Sum the squared deviation scores.
Calculate the variance by dividing the
sum of the squared deviation scores by the number of students minus one.
In this example 917.2 / 4 = 229.3. To get the standard deviation, take
the square root of the variance. In this example 229.2 = 15.143. Always
carry the decimal places to the third place.
|
Table 5
|
|

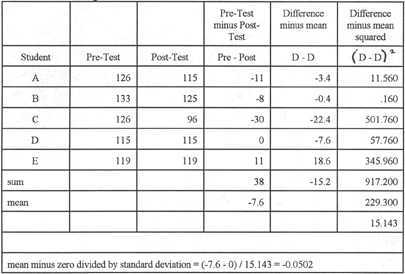
The sixth and final step is to apply
the formula.
|
Table 6
|
|

Our result now needs to be evaluated
based on the t-value we determined in the first step, from the table to
be our cut off for rejecting the null hypothesis.
REMINDER:
When we looked up in a Table of T values
to determine what value is the cutoff for rejecting the null hypothesis,
using our sample size of 5, the degrees of freedom of 4, and an alpha of
.05, and a two-tailed test, the t value needs to be greater than 2.776.
Our obtained t-value of -0.0502 is
not greater than 2.776; so we fail to reject the null hypothesis.
REMINDER:
The Null Hypothesis: There will be no change
in reading ability as measured by the ITBS for students who receive special
tutoring in reading.
Interpretation: Whatever changes
were observed between pre and post tests were due to chance. The special
tutoring in reading had no effect on reading ability in this sample as
measured by the ITBS.
 Return
to Module 9 Notes
|

