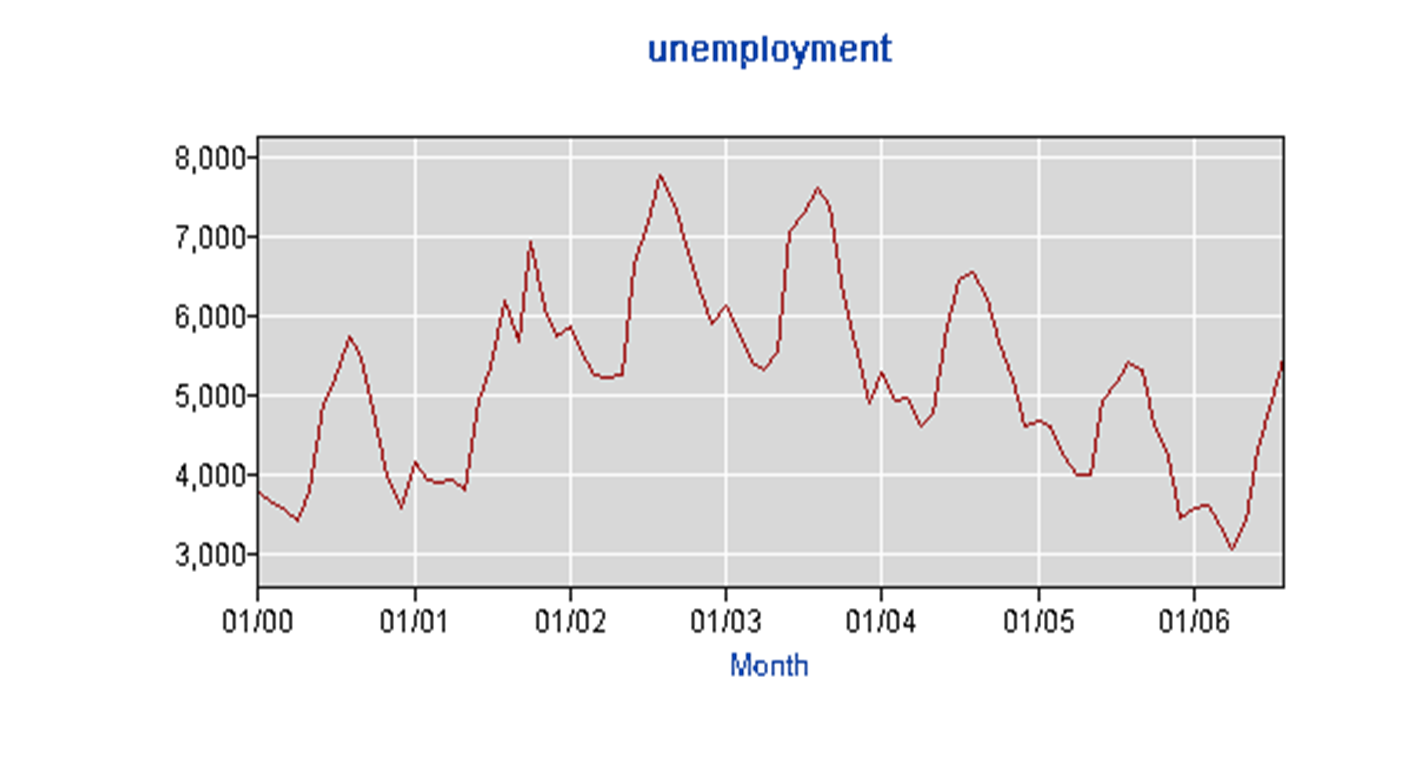
Unemployment rate coincides with seasonal fluctuations as you can see in the graph the lowest points indicate the fall and winter season, for that is the "fast" season. The highest points indicate the springs and the summers, when there is little work for mainly high turnover jobs. Through out the graph from 2000 to 2006, you can see that the slope of the overall graph is lower at in 2006 than in the beginning of 2000.