65 miles across
Affordable housing:
Housing costs in Lee County
Figure 1:
Lee County, Florida
|
|
|
|
|
|
65 miles across |
|
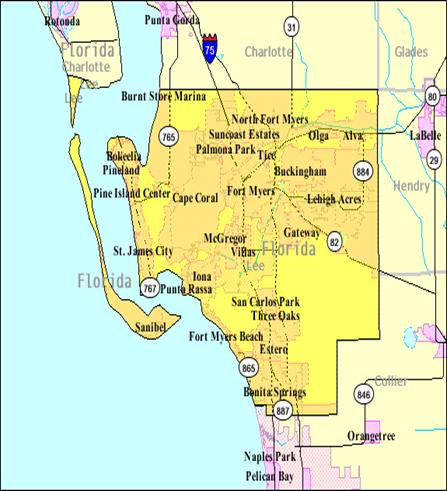
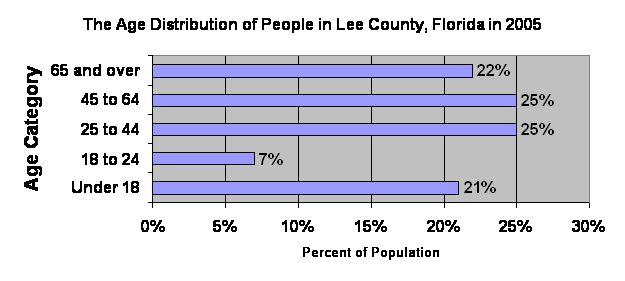
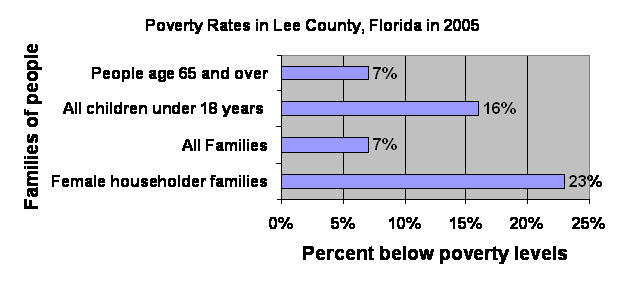
This is a map of Lee County. Lee County includes major areas such as N. Ft. Myers, Ft. Myers, Ft. Myers Beach, Lehigh Acres, Bonita Springs, Cape Coral, Sanibel and Pine Island. In 2004, Lee County had a population of 509,000 where 28% of the population was under 24 and 23% of the population was 65 and above. The population is rising and this means that more people will be in these categories. (Figure 1, 2 and 3). These two categories of age are the most vulnerable to increasing housing costs. The younger population either are in college or have not worked at their career long enough to be making a decent amount of money. A large percentage of the older population are on fixed incomes. Along with the age factor comes the fact that 26% of people are living alone, which means that there is only one income contribution to the mortgage or rent of these households. (Figure 4). These two scenarios are part of the reason why there needs to be something done about housing costs.
Figure 2:
View population trends...
|
|
2005 |
2000 |
1990 |
|
Population |
544,758 |
440,888 |
335,113 |
Source: U.S. Census Bureau, 2005 Population Estimates, Census 2000, 1990 Census
Figure 3:
Source: American Community Survey, 2005
Figure 4:
Source: American Community Survey, 2005
The price of housing and the amount of mortgage and rent payments have gone up since the year 2000. (Figure 5). The housing costs for Lee County include owner occupied units which include prices that vary from $50 thousand to one-million or more. In 2000, there were 36,876 units that were in the price range of $50,000 to $99,999 and only 5,171 units that were in the price range of $300,000 to $499,999. A lot has changed since the year 2000. The population has increased and so has the cost of living. In the year 2004, the number of units in the price range of $50,000 to $99,999 dropped to 30,022 units. In 2005, the numbers of units in the price range of $50,000 to $99,999 dropped even more to 18,245. In 2004, the number of units in the price range of $300,000 to $499,999 increased to 21,588 units and in 2005, to 37,442 units. (Figure 6).
Figure 5:

Source: American Community Survey, 2005
Figure 6:
Prices of Houses in Lee County
|
Year |
2000 |
2004 |
2005 |
| Owner-occupied units |
99,299 |
166,484 |
172,404 |
| Less than $50,000 |
5,504 |
14,706 |
13,253 |
| $50,000 to $99,999 |
36,876 |
30,022 |
18,245 |
| $100,000 to $149,999 |
26,452 |
34,250 |
21,070 |
| $150,000 to $199,999 |
12,646 |
31,301 |
22,793 |
| $200,000 to $299,999 |
9,550 |
23,385 |
36,800 |
| $300,000 to $499,999 |
5,171 |
21,588 |
37,442 |
| $500,000 to $999,999 |
2,318 |
9,052 |
18,645 |
| $1,000,000 or more |
782 |
2,180 |
4,156 |
| Median (dollars) |
112,900 |
155,899 |
223,100 |
The generally accepted definition of affordability is for a household to pay no more than 30 percent of its annual income on housing. Families who pay more than 30 percent of their income for housing are considered cost burdened and may have difficulty affording necessities such as food, clothing, transportation and medical care. An estimated 12 million renter and homeowner households now pay more then 50 percent of their annual incomes for housing, and a family with one full-time worker earning the minimum wage cannot afford the local fair-market rent for a two-bedroom apartment anywhere in the United States. (U.S. Department of Housing and Urban Development link)
The housing costs also affect the mortgage rates and the rental rates. With an increase in units in a particular price range, there is also an increase of people paying the mortgage and rent. In 2000, there were 19,883 units paying a mortgage of $1,000 to $1,499 per month. In 2004, there was a major increase in the number of units in this price range. The number of units with a mortgage of $1,000 to $1,499, increased to 34,015 in 2004, and in 2005, the number of units in this price range increased to 35,238. As far as renting goes the same trend occurred. From 2000 to 2005, the number of units in the price range of $1,000 to $1,499 per month increased from about 3,000 to 15,000. The number of lesser expensive units decreased. (Figure 7).
Figure 7:
Mortgage payments by year in Lee County
| MORTGAGE STATUS AND SELECTED MONTHLY OWNER COSTS |
|
|||
| Year |
2000 |
2004 |
2005 |
|
| Housing units with a mortgage |
68,216 |
104,808 |
105,643 |
|
|
Less than $300 |
300 |
221 |
217 |
|
|
$300 to $499 |
3,174 |
2,761 |
2,403 |
|
|
$500 to $699 |
10,479 |
12,333 |
7,666 |
|
|
$700 to $999 |
22,593 |
26,680 |
23,558 |
|
|
$1,000 to $1,499 |
19,883 |
34,015 |
35,238 |
|
|
$1,500 to $1,999 |
6,602 |
14,451 |
19,541 |
|
|
$2,000 or more |
5,185 |
14,347 |
17,020 |
|
|
Median (dollars) |
968 |
1,123 |
1,265 |
|
Figure 8:
Rent payments by year in Lee County
|
Year |
2000 |
2004 |
2005 |
| Gross rent | |||
|
Renter-occupied units |
44,222 |
47,328 |
62,629 |
| Less than $200 |
1,477 |
1,782 |
653 |
| $200 to $299 |
1,217 |
901 |
840 |
| $300 to $499 |
6,951 |
3,614 |
2,253 |
| $500 to $749 |
19,106 |
16,797 |
15,100 |
| $750 to $999 |
8,743 |
12,120 |
21,805 |
| $1,000 to $1,499 |
3,144 |
8,729 |
14,678 |
| $1,500 or more |
1,434 |
1,763 |
3,267 |
| Median (dollars) |
650 |
746 |
873 |
Another aspect of housing cost is how much income is contributed to the cost of the mortgage and to the cost of rent. Giving 35% of a family’s income to a mortgage or rental payment is a lot of money. In the year 2000, 35% or more of the income in 17,493 units were contributed to the mortgage payment. In 2004, the number of units that paid 35% or more of their income to mortgage increased to 26,736 units. In 2005, that number increased greatly to 32,672 units. (Figure9).
Figure 9:
Mortgages as a % of income in Lee County
| GROSS MORTGAGE AS A PERCENTAGE OF HOUSEHOLD INCOME | |||
| Year |
2000 |
2004 |
2005 |
| Less than 20 percent |
16,808 |
51355 |
35,175 |
| 20 to 24 percent |
13,777 |
17,465 |
16,753 |
| 25 to 29 percent |
9,682 |
15,100 |
11,390 |
| 30 to 34 percent |
5,995 |
10,217 |
9,250 |
| 35 percent or more |
17,493 |
26,736 |
32,672 |
| Not computed |
997 |
495 |
403 |
Renters also have to deal with paying a large percentage of their annual income to housing costs. Along with the mortgage payments, there was an increase in the number of people paying 35% or more of their income to their rental payments. There was 35% or more of the income in 13,509 units that was contributed to the rental payment in the year 2000. In 2004 and 2005 that number increased. There was a slight increase to 14,634 units that paid 35% or more of their income to rent in 2004. However, in 2005 the increase in units that paid 35% or more of their income to rental payments increased nearly half of units in 2004. This means that there were 21,827 units paying 35% or more of their income to rent. (Figure 10).
Figure 10:
Rent as a % of income in Lee County
| GROSS RENT AS A PERCENTAGE OF HOUSEHOLD INCOME | |||
| Year |
2000 |
2004 |
2005 |
| Less than 20 percent |
13871 |
14333 |
12769 |
| 20 to 24 percent |
5,892 |
5,227 |
7,312 |
| 25 to 29 percent |
4,879 |
3,623 |
8,735 |
| 30 to 34 percent |
3,491 |
6,898 |
7,243 |
| 35 percent or more |
13,509 |
14,634 |
21,827 |
| Not computed |
3,048 |
2,613 |
4,743 |