Housing Costs in Collier County
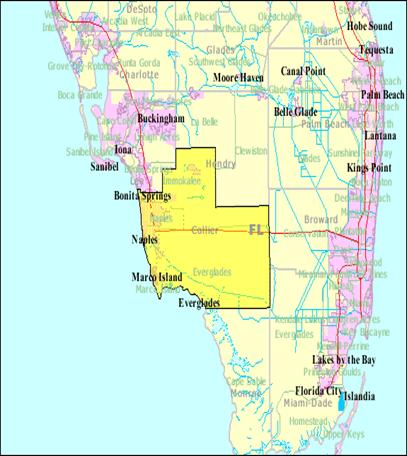
The Collier County City limit includes part of Bonita Springs heading south to the Everglades. The actual land mass of collier county is 2025.3 sq. mi. The water area covered in this county is 279.6 sq. mi. The population is 251,377 people.
Collier County was created in 1923, and was basically split from Lee County due to Lee County’s growth. The County was named after an advertising mogul and real estate developer, Barron Collier.
The county seat is Naples, and Collier County is actually the only county in the Naples and Marco island vicinity.
|
Year |
2000 |
2005 |
|
Owner-occupied units |
46,493 |
89,520 |
|
Less than $50,000 |
685 |
2,348 |
|
$50,000 to $99,999 |
7,616 |
2,990 |
|
$100,000 to $149,999 |
11,494 |
5,279 |
|
$150,000 to $199,999 |
8,135 |
6,332 |
|
$200,000 to $299,999 |
7,759 |
16,266 |
|
$300,000 to $499,999 |
5,819 |
26,600 |
|
$500,000 to $999,999 |
3,346 |
20,760 |
|
$1,000,000 or more |
1,639 |
8,945 |
|
Median (dollars) |
168,000 |
375,600 |
Collier County went through a rapid growth spurt in a mere thirty year span. In 1950, the recorded population for Collier County was 6, 488. Thirty years later in 1980, the population had increased to 85,000 making Collier County one of the fastest growing areas in the country.
Due to this growth, the real estate market had to grow along side with the population. You can understand the rapid growth by simply looking at the owner-occupied units in Collier County in the years 2000 and 2005. In 2000, there were only 46, 493 owner occupied units by 2005 that number had increased to 89,520.
This graph points out the rise in cost of Housing from 2000 to 2005. In 2000, the majority of the housing was in the range of $100,000 to $149,000. This seemed a very reasonable price range for an up and coming area. However, by 2005 the majority of housing ranged from $300,000 to $499,000. Therefore the Housing costs in Collier County have actually tripled in price, if not quintupled, depending on which end of the spectrum you look at.
|
Year
|
2000
|
2005
|
|
With a mortgage
|
31,302
|
55,690
|
|
Less than $300
|
55
|
279
|
|
$300 to $499
|
759
|
1,096
|
|
$500 to $699
|
2,207
|
2,532
|
|
$700 to $999
|
7,759
|
7,083
|
|
$1,000 to $1,499
|
10,667
|
15,227
|
|
$1,500 to $1,999
|
4,684
|
13,454
|
|
$2,000 or more
|
5,171
|
16,019
|
|
Median (dollars)
|
1,200
|
1,553
|
|
Not mortgaged
|
15,191
|
33,830
|
|
Median (dollars)
|
412
|
556
|
The US Census Bureau provided this graph; it has also provided us with the information of how many people in collier county pay mortgage and how much they pay. The graph compares the statistics from the year 2000 and the year 2005.What is alarming in this graph is the increased mortgage cost in such a short period. In 2000 the median cost for a mortgage in Collier County was $700 to $999. Five years later, the median cost rose to $2,000 or more
|
GROSS MORTGAGE AS
A PERCENTAGE OF HOUSEHOLD INCOME
|
||
|
Year
|
2000
|
2005
|
|
Less
than 15 percent
|
16,863
|
N/A
|
|
15
to 19 percent
|
6,813
|
14.382
|
|
20
to 24 percent
|
5,720
|
7,867
|
|
25
to 29 percent
|
4,176
|
6,461
|
|
30
to 34 percent
|
2.873
|
5,047
|
|
35
percent or more
|
9,465
|
21,882
|
|
Not
computed
|
583
|
51
|
This graph is basically showing the percentage of income that is spent on a mortgage. To sum up, the graph is basically showing that the majority of the people paying a mortgage in 2000 were spending less than 15% of their total income on their mortgage. In 2005, the majority of the people were paying 35% or more of their income on their mortgage.
According to Wikipedia the average income for a household in Collier County is $48,289. That means that 35 % of the average income is $16, 901. Therefore the money left over for insurance, community costs, children, food, hurricane insurance, and car costs is only $31, 388, and remember these numbers are for a household, not a single person.
References:
http://en.wikipedia.org/wiki/Collier_County,_Florida
|
Year
|
2000
|
2005
|
|
Renter-occupied units
|
25,087
|
31,651
|
|
Less than $200
|
653
|
392
|
|
$200 to $299
|
688
|
54
|
|
$300 to $499
|
2,902
|
1,313
|
|
$500 to $749
|
7,394
|
3,866
|
|
$750 to $999
|
7,562
|
9,575
|
|
$1,000 to $1,499
|
2,517
|
10,008
|
|
$1,500 or more
|
1,844
|
4,818
|
|
Median (dollars)
|
753
|
997
|
The US Census Bureau provides this graph. Providing statistics of rent payments in Collier County for the years 2000 and 2005. It has basically stated that the majority of renters were paying $750 to $999 per month in 2000. In 2005, the majority of people were paying $1,000 to $1,499. Also there is a noticeable decrease in available units for under $749 between the span of five years.
|
GROSS RENT AS A
PERCENTAGE OF HOUSEHOLD INCOME
|
||
|
Year
|
2000
|
2005
|
|
Less
than 15 percent
|
16,863
|
2,387
|
|
15
to 19 percent
|
6,813
|
2,991
|
|
20
to 24 percent
|
5,720
|
4,472
|
|
25
to 29 percent
|
4,176
|
3,699
|
|
30
to 34 percent
|
2,873
|
2,974
|
|
35
percent or more
|
9,465
|
13,315
|
|
Not
computed
|
583
|
1,813
|
This graph is representing the percentage of household income spent on rent. Compared to 2000 where the majority of renters were spending les than 15% of their income on rent in Collier County, the majorities were spending more than 35% in 2005.
The only increases in percentages were 30% and up, everything else below has decreased in five years. This also effects the general households income severely.