Laboratory
1. CBC Part I: Cells Counts
INTRODUCTION
The
minimum performance expectation for
this laboratory exercise requires you to:
1.
Come
to class on time and be prepared to participate by reading this assignment
ahead of time!
2.
Ask
questions.
3.
Practice
safety.
4.
Select
and prepare reagents, identify specimens suitable for analysis, and use
instruments to generate test data.
5.
Apply
principles of basic laboratory procedures in order to perform these tests:
ü
Manual
cell counts
ü
Automated
cell counts
6.
Perform
quality control and take corrective actions when necessary to ensure the
validity of test results.
7.
Plan
and select procedural courses of action appropriate for the samples used, the
test to be performed, and which allows you to complete tasks accurately, and
responsibly in the class time allotted.
8.
Evaluate
hematology results to identify sources of error in testing and to discriminate
between states of health or disease.
9.
Calculate
results from test data.
10.
Assess
test and quality control data in order to validate results.
11.
Report
your results.
12.
Develop
a hematology lexicon and use the vocabulary to identify, explain, interpret and
report data.
IN THE
BEGINNING
Hematology is a term which literally means the study of
blood. However, practically speaking,
hematology involves the evaluation of the blood cells—erythrocytes or red blood
cells [rbcs], leukocytes or white
blood cells [wbcs], and thrombocytes
or platelets [plts]—in terms of
the number of cells present in a volume of whole blood, and a descriptive
report of their morphology and functionality.
There are a number of specific hematology tests which can be done to
evaluate a person’s blood. One such test is the complete blood count (CBC).
When a doctor orders this test, the report received will include at a
minimum the following data:
ü
Total white blood cell count [WBC]
ü
Total
red cell count [RBC]
ü
Absolute
quantitative hemoglobin [HGB or HB]
ü
Hematocrit [HCT]
ü
White
cell differential
ü
Red cell indices [MCV,
MCH, MCHC]
CBC data is often used to evaluate
a person’s ability to fight disease, to monitor the effect(s) of drug therapy,
to formulate a prognosis, and it is
used in the diagnosis of disease.
While the CBC is one of the most frequently ordered lab tests, physicians do
have the option of ordering individual tests [e.g., HCT, or HGB], or
combinations of tests that best meet the need of the doctor and patient.
BLOOD CELL COUNTS
Blood
cell counts may be performed manually or by using automated cell counters. Manual counts are often performed it cases
of extremely low (-cytopenia) or
high (-cytosis) blood cell counts,
or when cell counts are needed on body fluids such as cerebrospinal fluid (CSF) or seminal fluid
Technical Information
Units of Reporting Cell Counts
The International Committee for Standardization in Hematology [ICSH] recommends
the liter (L) as the volume unit to
be used when reporting blood cell counts.
Thus, cell counts are reported as the number of cells (i.e., wbc, rbc,
and plt) per liter of blood. However, you
may see counts reported per cubic
millimeter (cu mm or mm3) or
per microliter (ml). Therefore,
you must learn and be prepared to convert data reported in one unit of measure
to other units of measure. Remember the
following mathematical relationships:
1 mm3 = 1 ml = 10-6 L Examples
of cell count data:
1 x 10⁶ ml = 1 L
WBC 6.5 x 10⁹/L = 6.5 x 10³/ml
or 6,500/ml
RBC 4.3 x 10¹²/L = 4.3 x 10⁶/ml
or 4,300,000/ml
Methodology
Diluents
and Dilutions
Normally, whole blood
contains thousands of white cells, hundreds of thousands of platelets, and
millions of red cells. In many cases,
blood must be diluted before a manual cell count is
performed. The diluent used and how
large a dilution is made, is
determined by the cell(s) to be counted and the method used to perform the
count. By convention, physiologic saline (0.85%) is the
diluent of choice for a manual RBC. It
prevents cell lysis, and inhibits rouleoux. Three per cent [3%] acetic acid is the diluent of choice for a
WBC. However, one percent hydrochloric
acid or Turk’s diluting fluid may
also be used. [Turk’s fluid contains gentian
violet which stains the nuclei of wbcs, making them more visible]. These
solutions lyse rbcs, making wbcs easier to identify.
One per cent [1%]
ammonium oxalate is the preferred diluent for manual platelet counts. It not only lyses rbcs, but it inhibits platelet aggregation and reduces platelet adhesion tendencies. Ammonium oxalate may be used when both a WBC
and a PLT are performed simultaneously.
The direct, manual
method for counting eosinophils
requires the use of phyloxine
diluting fluid which contains water, phyloxine, sodium bicarbonate, heparin,
and propylene glycol. The phyloxine
stains the eosinophils red, while the sodium bicarbonate and water help to lyse
all other wbcs. The propylene glycol
lyses the rbcs. The addition of heparin
prevents cell clumping.
Typically, the dilution
for a manual WBC is 1:20, for a manual RBC it is 1:200, for an Eosinophil count
it is 1:32, and for a manual PLT it is 1:100. However, in certain conditions,
expected cell counts may be extremely high [i.e., leukemoid reaction] or low [i.e., anemia]. In such cases, the
dilution made is accordingly adjusted.
Automated cell counters
use a variety of brand-specific solutions for making dilutions of blood. For example, Beckman Coulter hematology
analyzers use Isotonä, a preserved isotonic
solution. Dilutions made are also
instrument-specific, but generally are larger than ones made for manual counts
[e.g., TOA Sysmexä E-5000 makes a 1:750 dilution for a
WBC].
Pipettes
[Manual Cell Counts]
Historically, micropipettes are used to make dilutions of whole blood. One such pipette is the Thoma pipette. It comes in
two varieties: white cell or red cell.
Each pipette is divided into parts or volumes, so indicated by marks on
the body of the pipette (figure 1). The
stem of each pipette holds a total of 1.0 part while the bulb holds 10 parts
[white cell] or 100 parts [red cell].
To make a dilution using these pipettes requires that blood be aspirated
first into the stem. Subsequently, as
diluent is aspirated, all the blood is pushed into the bulb. To calculate the dilution made only requires
that you know to what mark on the pipette stem blood was drawn, and the type of
pipette used. For example, if a white
cell Thoma is used, and blood is aspirated to the 0.5 mark, then diluted to the
11 mark, a 1:20 dilution is made. [Hint:
0.5 volumes in 10 volumes].
Figure 1. White and Red Cell Thoma pipettes (Steine-Martin et al. 1998)

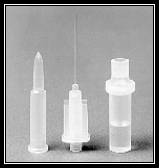
Today, the
Unopetteä
is the preferred method for performing timely manual cell counts safely and
accurately. The standard Unopetteä
system (figure 2) comes with a reservoir containing a set volume of diluent, a self-filling pipette, and a pipette
shield. Systems are available for
WBC, PLT, RBC, Reticulocyte counts, Eosinophil counts, and for use with
automated instruments. Table 1 lists
the common Unopetteä diluents, volumes and pipettes used for
specific cell counts.
Figure 2.
WBC Unopette system with reservoir, pipet, and pipet shield.
1.
Protects pipet and is used to puncture the reservoir
diaphragm. 2.
Is
self-filling and size matched with various reservoirs. 3.
Contains
a pre-measured volume of diluent and is sealed with a plastic diaphragm. (1) Pipet shield (2) Pipet (3) Reservoir
![]()
![]()
![]()
Table
1. Unopette
reservoir diluents, volumes, pipet sizes, and final dilutions made.
Test Diluent Pipet , ml Dilution
|
WBC |
3% acetic acid, 1.98
ml 3% acetic acid, 0.475
ml |
20 25 |
1:100 1:20 |
|
WBC/PLT |
1% Ammonium Oxalate,
1.98 ml |
20 |
1:100 |
|
RBC |
0.85% Saline, 1.99 ml |
10 |
1:200 |
|
Eosinophil |
1% Phloxine B, 0.775
ml |
25 |
1:32 |
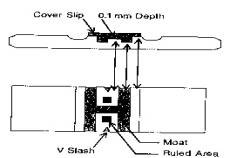
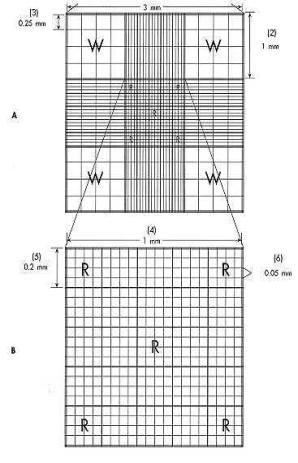
Hemocytometers are
calibrated glass slides. This means
that ruled dimensions are cut into the glass, thus creating a counting chamber (figure 4). In the case of the Neubauer, the dimensions
are: (1) length, 3 millimeters; (2)
area, 9 square millimeters; and (3) volume, 0.9 cubic millimeters.
Figure 4. Neubauer counting chamber.
(Stiene-Martin et al. 1998)
![Text Box: Notice that the entire counting chamber is subdivided into proportionally smaller squares, each with length and width, and that the platform on which the counting chamber is located is exactly 0.1 mm in depth. For example, there are nine large squares (primary squares), each with dimensions equal to 1 mm x 1 mm x 0.1 mm. The center primary square is further divided into twenty-five secondary squares, each with dimensions equal to 0.2 mm x 0.2 mm x 0.1 mm. Likewise, each secondary square is divided into sixteen tertiary squares, each with dimensions equal to 0.05 mm x 0.05 mm x 1 mm.
Historically, the four corner primary squares [“W”] are used when performing a manual white cell count, and secondary squares [“R”]--four corner and center--are used when performing a manual red cell count. The center diagonal secondary squares plus one other are used for manual platelet counts.](./Hem01Lab1a_files/image010.gif)
General Principles of Automation
There are three basic principles
of operation employed by automated instruments to count cells. They are electronic impedance, light scatter, and centrifugal force. Each principle exploits a physical attribute of
cells. For example, electronic
impedance technology is based on the fact that cells are poor conductors of
electricity, while instruments that measure light scatter depend upon the fact
that cells have volume and optical density.
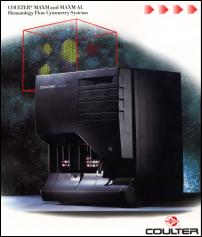
Electronic Impedance
In late 1948, Wallace H.
Coulter discovered what has become known as the “Coulter Principle”. This principle takes advantage of the fact that
cells are relatively poor conductors of electricity compared to a physiologic
electrolyte solution. The early model
Coulter counter was composed of: (1) a sensing mechanism made of a small aperture sandwiched between two
platinum electrodes immersed in an
electrolyte solution; (2) motors, pumps, valves and tubing designed to dilute
blood and move suspended cells through the aperture; (3) an electronic signal
processing system made of electronic
circuits that analyze electrical pulses and counters that count the number
of cells within a specified size range.
Figure 5 illustrates this “electronic
gate” used to count cells.
How does a cell counter count
cells accurately? As a cell is pulled
through the aperture, a change in the voltage of the sensing system occurs, and
a pulse is generated. Each pulse
corresponds to a cell and is proportional to the volume of that cell. Cells of different sizes may be
discriminated by pulse height analyzers.
To eliminate the counting of non-cellular material, the cell counter must be calibrated and thresholds set. By definition, a threshold is a voltage limit with which a pulse is compared. Think of upper and lower thresholds as
pulses corresponding to small and large sizes of cells. Manipulating the thresholds permits the
establishment of size ranges. Pulses
generated by non-cellular material which is above or below the thresholds would
be eliminated from the cell count.
Figure 5. The “Heart” of the Early Electronic
Gate Cell Counter. (Linne’ & Ringsrud, 1999)
Early model cell counters were
referred to as “single-parameter”
instruments because they could count only one blood cell type at a time: either red cells, white cells, or
platelets. Other cell data was manually
calculated. Today, cell counters are “multiparameter”: that is, they are capable of simultaneously
counting rbcs, wbcs, plts, and they can carry out complex mathematical
calculations to derive hemoglobin, hematocrit, and indices data.
Light
Scattering
This
technology exploits the fact that cells have optical density. Cells are counted as they pass through a
focused beam of light. The light source
in this case is a laser (light amplification by stimulated emission
of radiation). A typical Optical
Gate cell counter is composed of a small-volume flow cell located between a helium-neon laser source and photosensors which are capable of
measuring the amount of light scattered by a cell (figure 6).
A cell’s
interaction with radiant energy will
result in the light waves being bent (diffracted),
re-directed back (reflected), and refracted (bent because of a change in
speed). Relative to cell counting by
light scatter, it has been observed that light is scattered in all directions
when intercepted by a cell, that diffraction is the predominant event in the acute angles relative to the incident light, that reflection occurs
predominantly at the obtuse angles, and
refraction generally occurs at intermediate angles. This knowledge is also used
to differentiate white cells types: a
lymphocyte from a neutrophil from a monocyte.
Figure 6.
Optical Gate Cell Counter. (Stiene-Martin et al. 1998)
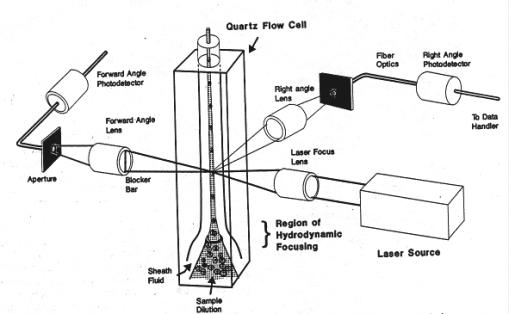
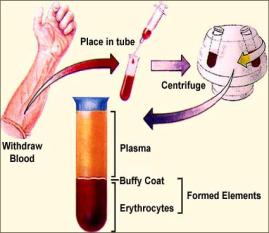
Figure 8. Centrifugal effect on whole blood. Figure
9. ![]()
![]() Monocytes
& Lymphocytes
Monocytes
& Lymphocytes
![]()
![]()
![]()
![]() bottom
bottom![]()
Red Cell Count Data Report Form
Student
Name: ________________________ Date: _______________
![]() Formula: Number
of cells counted x dilution factor = cell count/ml
Formula: Number
of cells counted x dilution factor = cell count/ml