| |
|
|
|
Module
Ten
Notes on Correlation
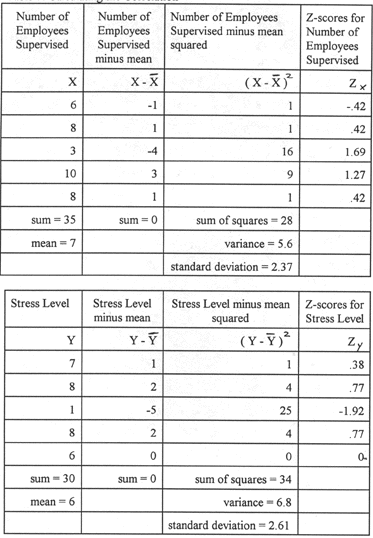
The sixth step is to convert all the scores to z-scores. Remember, to do this you must take the raw score, subtract the mean, and divide by the standard deviation. In the second column, we have the raw score minus the mean for the variable AX. So if we take these and divide them by the standard deviation for AX (2.37), we will have the z-scores for AX. In the ninth column, we have the raw score minus the mean for the variable AY. So if we take these and divide them by the standard deviation for AY (2.61), we will have the z-scores for AY. Be careful of
your signs. Remember, if you divide a positive number by a positive
number, you get a positive number. If you divide a negative number
by a positive number, you get a negative number.
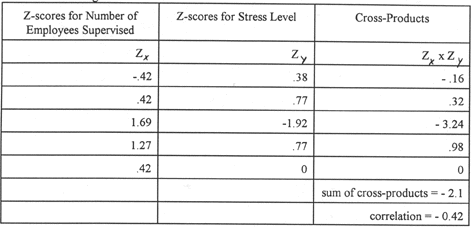
The seventh step
is to multiply the z-scores for AX by the z-scores of AY. The results
are called cross-products.
The eighth step is to sum these. The result is called sum of cross-products. Remember your signs. The easiest way I have found to do this is to add all the positive numbers together (here you would get 4.54). Then add all the negative numbers together (here you would get -.16). Then do 4.54 - .16). Then divide the sum of cross-products by the number of cross-products (here we have 5). This is called the correlation! In the first step
where you plotted the scores creating a scatter plot, did you determine
that the correlation would be positive? Did you determine that the
correlation would be strong? |
| |
|
|
| Course
content developed by Cindy Conley, Ph.D and Andrew McConney, Ph.D. All rights reserved. Do not reproduce without permission. (c) 2004 Florida Gulf Coast University |
This
is an official FGCU web page. FGCU is an equal opportunity/ affirmative action institution. |